When viewing a historic inventory valuation for an item with serial number tracking, Infusion displays both the latest and average figures, on both an individual item and total on hand amounts.
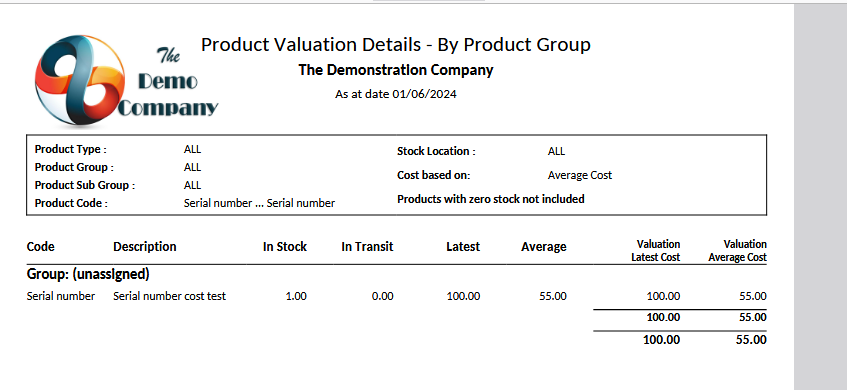
For example if a new item was purchased on the first of the month at one price, and then again on the sixth at a different price. When the Product Valuation report is run for the period of the first to fifth of the month it will show:

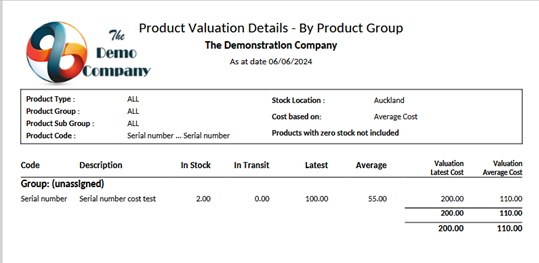
As there’s only one on hand at this point, the In stock quantity is 1. The latest cost is the latest cost of the product, which is what it was purchased for on the sixth. The average figure is the average across both purchased items.
The latest figure on the reports would only change if the next time the item was purchased the cost was different.
In contrast the Average figure will change the next time the item is purchased, regardless of the cost of the item.
The valuation figures, Valuation Latest Cost and Valuation Average Cost represent the overall totals and are the In Stock figure multiplied by the corresponding Latest or Average cost figure displayed on the report:


